| Well, maybe we don’t really so much mean United States “against the world” as United States stock market “versus” the rest of the world. In any case, we’ve gotten a few inquiries of late from clients wondering why their portfolios haven’t been soaring as the S&P 500 has been hitting new all time highs. The reason is that not all of our portfolios are allocated to U.S. stocks, let alone U.S. large company stocks. While we very consciously dial up the exposure to small company and value stocks in our portfolios, we believe that it makes sense to be geographically “neutral,” allocating the portfolio to countries and regions in a way that is proportional to their respective share of the world stock market. This means that not quite half of our stock allocation is invested in the United States, with the rest allocated to overseas markets. With the S&P 500 gaining 10% year-to-date and the MSCI EAFE Index (Europe, Australasia, and the Far East), which measures developed market performance outside the U.S., losing 5% over that same period, it’s understandable that people are wondering about the virtues of global diversification.
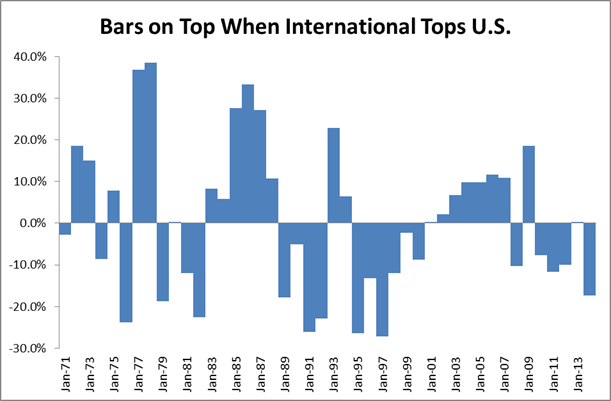
As soon as we begin to take the long view, however, the virtues of being global become clearer. The chart below was created by subtracting the annual returns to the S&P 500 from those to the EAFE Index. This means that when non-U.S. stocks have higher returns than U.S. stocks, our calculation results in a positive number and when U.S. stocks are doing better, we end up with a negative number. So when the bars are on top, non-U.S. stocks dominate and when the bars are on the bottom, U.S. stocks have the upper hand. As you can see, the two regions trade leadership quite frequently, though not in a predictable pattern. And while domestic stocks have had higher returns in four of the last five years, overseas markets did better in seven of the past 12. |
| But that’s not the end of the story, the other thing to note is that one result of the US doing better in recent years is that it has become one of the most expensive markets in the world as measured by Shiller’s CAPE (Cyclically Adjusted Price-to-Earnings), a common measure of market valuation levels. From the chart below, we’ve shown the CAPE for selected countries. As you can see, most other major markets are sporting a lower valuation than the US market. All other things being equal, this suggests that returns in the future will be higher in those markets and lower in the US. |
| At the end of the day, a true “all-weather” portfolio is going to be one that is diversified across at least three different dimensions: geographically, across broad categories (like small company and value stocks), and within each category. And as is always the case with diversification, the highest performing category is never more than one part of the larger whole, but then again, the same thing can be said of the lowest performing category.
On another international note, Dave and Elissa head to Korea on Sunday to take a first-hand look at the Korean stock market. Dave will be the keynote speaker at the Korean Financial Planning Association’s annual conference and Elissa will be running a workshop. |


