
Yeske Buie Investment Updates
New Blended Benchmark
We’ve added a new blended benchmark to our monthly portfolio performance reports that we thought you’d like to hear about. Beginning with the current batch of reports posted a few days ago, a new blended benchmark appears in several places. First, the graph on page three showing the cumulative return to your portfolio “since inception,” is now accompanied by a blended benchmark designed to match your portfolio’s relative allocation to stocks and bonds. The returns to this blended benchmark also appear on the Portfolio Performance Page, matched to each of the four reporting periods (Year-to-Date, 12-months, 3-Years, and since inception).
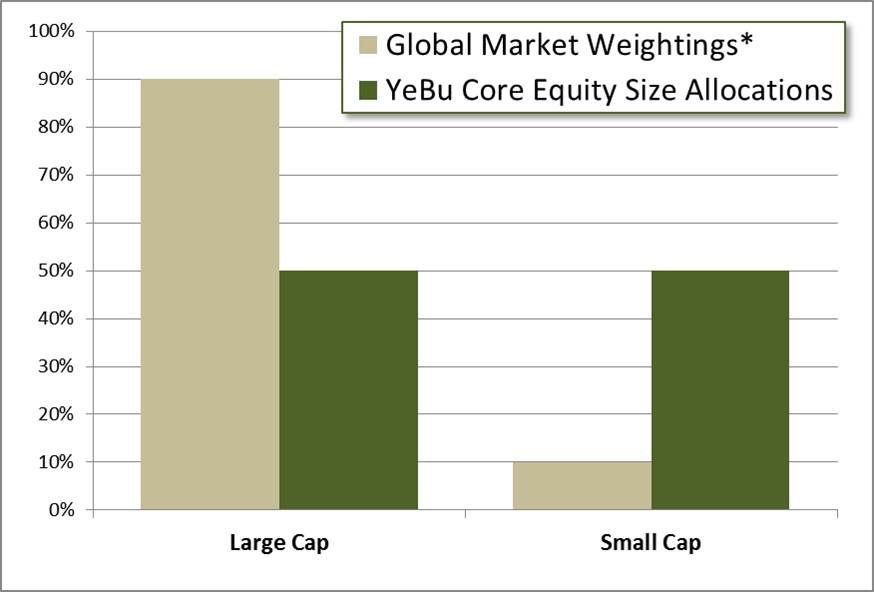
The benchmark is formed by combining the Citigroup World Government Bond Index 1-5 Years (hedged to the US Dollar) and the MSCI All Country World Index (ACWI). This benchmark resembles your portfolio in that it represents a “neutral” geographic allocation, weighting each country’s share of the index in a way that’s proportional to its share of the world market (for more on this, see “Portfolio Strategy Update: Toward a Truly Global Portfolio”). The stock portion of the benchmark is also “market weighted,” which means it holds stocks according to their relative share of the market. This results in the benchmark being skewed toward larger, blue chip stocks. As an example of the impact of “market-weighting,” the Wilshire 5000 Index, which represents the 5000 largest stocks in the U.S. is also market-weighted. As a consequence of this, 70% of the value of the index is accounted for by the largest 500 stocks out of 5,000. Thus, while buying the Wilshire 5000 Index theoretically gives you exposure to both large and small company stocks, it behaves more like a large stock index because so much weight is given to the largest 500. For all practical purposes, the Wilshire 5000 Index is little different from the S&P 500.
Since the blended benchmark is market-weighted, it allows us to measure the impact of the strategic decision we’ve made to significantly dial up your exposure to small company and value stocks. We hope you find the new benchmark useful and informative!
 * source: Russell Investments
New Small Account Portfolio
One of the challenges we face when managing portfolios is keeping transaction costs as low as possible. The Vanguard and DFA mutual funds and the exchange-traded funds (ETFs) that we use to construct our core portfolio are all subject to transaction fees when we trade. For larger transactions, these fees are quite modest and of little consequence. These transaction fees are subject to minimums, however, so on very small transactions, the kind that occur when we’re investing or rebalancing a smaller account, the fee can become significant. To deal with this, we’ve always had a “small account” model that used no-transaction-fee (NTF) funds available in the Schwab Mutual Fund Marketplace. We would choose a mix of NTF funds that we felt got us as close as possible to the “ideal” represented by our larger account model. These smaller account models were never ideal and represented a compromise between expenses and asset allocation. In recent years, however, Schwab has been developing a growing number of low-cost, no-transaction-fee index funds, which now represent enough depth and breadth that we feel we can build a much more attractive small-account portfolio exclusively from these Schwab index funds. A further advantage is that these can be purchased in increments as low as $100 each, making this new model feasible for the smallest of accounts. If you have a small account, a rollover IRA, for example, you’ll see trades in the coming days as we make the shift to this new portfolio. The chart below shows the core stock allocations; a bond index fund is added to bring each portfolio to its appropriate balance.

You’ll note that several of the funds include the word “fundamental” in their title. This refers to an indexing technique that weights individual stocks within the index by sales or dividends rather than by market capitalization. Stocks whose prices are low relative to sales or dividends generally fall into the category of value stocks, so these indexes have a significant “value tilt,” which we like to engineer into every client portfolio.