
2013 Portfolio Review
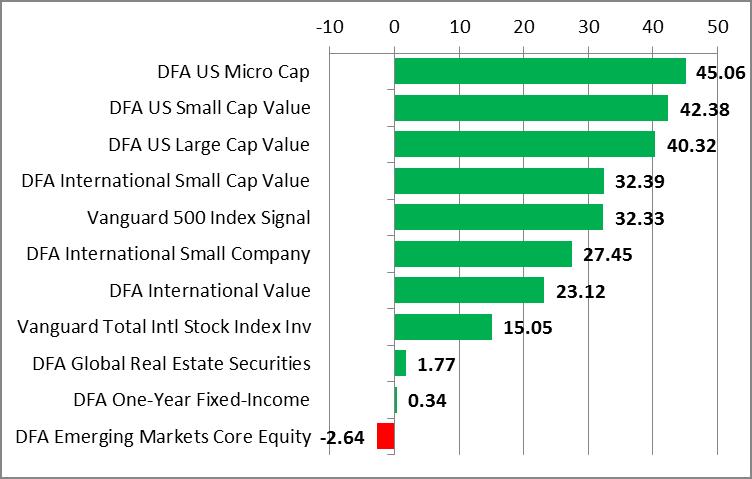
Everyone by now is aware of the great year that the S&P 500 had in 2013, returning more than 32%, its best performance since 1997. We thought this might be a good time to review the overall performance of our clients’ portfolios for the year, not least because they’re much more diverse than the S&P 500, encompassing, as they do, not just the 500 domestic Blue Chip stocks of the S&P index, but value stocks and small company stocks the world over. To begin with, here are the numbers, ranked from highest performer to lowest, for our “Large Account” portfolio (here’s a description of why we have different “Large Account” and “Small Account” portfolios):

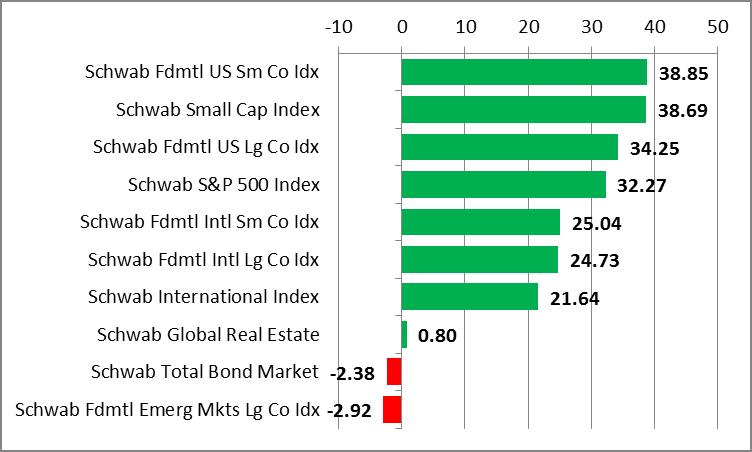
And now here’s the performance of the funds used in our “Small Account” portfolio, ranked from highest returns to lowest:
To the degree there were any themes or patterns of note, they would seem to be the following (all numbers based on our Large Account portfolio):
- It was a good time to be small. The US micro-cap and small cap value funds that we use returned an impressive 45% and 42%, respectively. And although non-US stocks in general did less well than domesic stocks in most categories, the international small value fund managed to edge out even the S&P 500, returning 32.39% versus the S&P’s 32.33%.
- Value stocks were also in the ascendant. The US large value fund returned more than 40% for the year and, as noted above, the international small value fund edged out all other non-US stock categories.
- Global real estate securities cooled down considerably, retuning just 1.77% compared to more than 23% in 2012.
- Emerging markets were the losers in 2013, with the emerging market fund losing 2.64% compared to a gain of over 20% in 2012.
Putting it all together
The combination of all of the above led the Large Account core stock portfolio to a combined return of 25.55% for the year while the Small Account core stock portfolio returned 23.69%. And, of course, the actual return to any given client portfolio would have been lower than the foregoing, depending on how large an allocation they had to cash and bonds. Cash balances basically offered a zero return in 2013, while the DFA One-Year Fixed Income portfolio — to which, you may recall, we allocated all bond investments as a consequence of our concerns over interest rate risk (see Investment Update: Going Short (Really Short!) — had a total return in 2013 of just 0.34%. So, for example, a portfolio allocated 70% to stocks and 30% to cash and bonds would be expected to have had a return of around 17%, depending on the timing of deposits and withdrawals.
In any case, while cash and bond allocations offer little or no return under current market conditions, they remain important as a source of reserves for rebalancing during any cyclical downturn in the stock market, or as a bridge to meet the spending needs of retired clients during such a downturn.
The virtues of a truly diversified portfolio
Although the modest to negative returns to real estate securities and emerging market stocks were a bit of a drag on the rest of the portfolio, we generally like to see variability among the different asset classes in a portfolio. If everything is moving in the same direction on the upside, chances are good that everything will be moving in the same direction on the downside. It’s worth noting that the global real estate category, while performing near the bottom of the pack in 2013, actually led all other categories in 2012, returning over 23% compared to the S&P 500’s 16%. It’s important to have allocations that are sufficiently-diversified that they will often trade leadership from year-to-year, smoothing out the ride for the portfolio as a whole.