
All Aboard for the Long Haul

The 2014 edition of Dalbar’s long-running study of mutual fund investors (which we’ve written about before) has been released and the results are consistent with every prior edition. Yet again, the numbers suggest that the average stock mutual fund investor tends to buy high and sell low, achieving returns that are far below the market as a whole. As of the end of 2013, the Dalbar study shows the average stock mutual fund investor achieving an average annual return of 3.69% since the research began in 1984, compared to 11.11% for the S&P 500. Admittedly, the average stock mutual fund did worse than the S&P 500 over the last 30 years, but the funds nonetheless did a lot better than the individuals who invested in them. 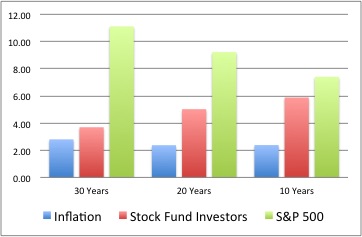 Writing about the Dalbar study in the Wall Street Journal, Jason Zweig makes the same point regarding mutual fund performance compared to the S&P 500. Zweig also notes some critiques of the Dalbar methodology, which is not made explicit in the company’s official report. It clearly uses a weighting scheme that calculates some version of “dollar-weighted” returns to determine the experience of the average investor, comparing it to a “time-weighted” return that assumes a constant one-dollar investment in the fund (see our Financial Planning Wonk post on this concept). Zweig likens it to a train traveling from Chicago to San Francisco, with people getting on and off at various points. Only someone who boards in Chicago and remains on the train until it arrives in San Francisco will experience the full 2,438 miles, just as an investor will only capture a mutual fund’s theoretical return over a given period if she’s continuously invested the whole time.
The way that “dollar-weighted” returns are calculated is like a train in which the number of miles credited is not just a function of distance but also how many people were on the train during each leg of the trip. So, if twice as many people board the train in Omaha and then get off in Denver, that leg of the trip is given twice as much weight. Morningstar calculates their own “investor returns” in this fashion, weighting the returns earned by fund investors by how many dollars they have invested in any given month. What this shows is that mutual funds that have big inflows and outflows will tend to have an “investor return” that’s very different ” than the “fund return.”
As two examples of how Morningstar’s two rate-of-return measures can vary, consider the Fidelity Magellan fund, which became a household name during the 13 years that it was run by legendary investor Peter Lynch. For the 15 years ending April 30, 2014, the “fund” performance was an annualized 2.44% compared to an annualized loss to investors of 0.64% per year. By contrast, the DFA US Large Cap Value fund, where investors tend to stay put, had an annualized fund return of 7.34% during that same 15 year period and an almost-identical investor return of 7.27% per year.
Clearly, if you’re going to board the investment train, you’ll do best if you commit to staying onboard for the long haul!