Bond Returns Have Been a Bust – What Gives?


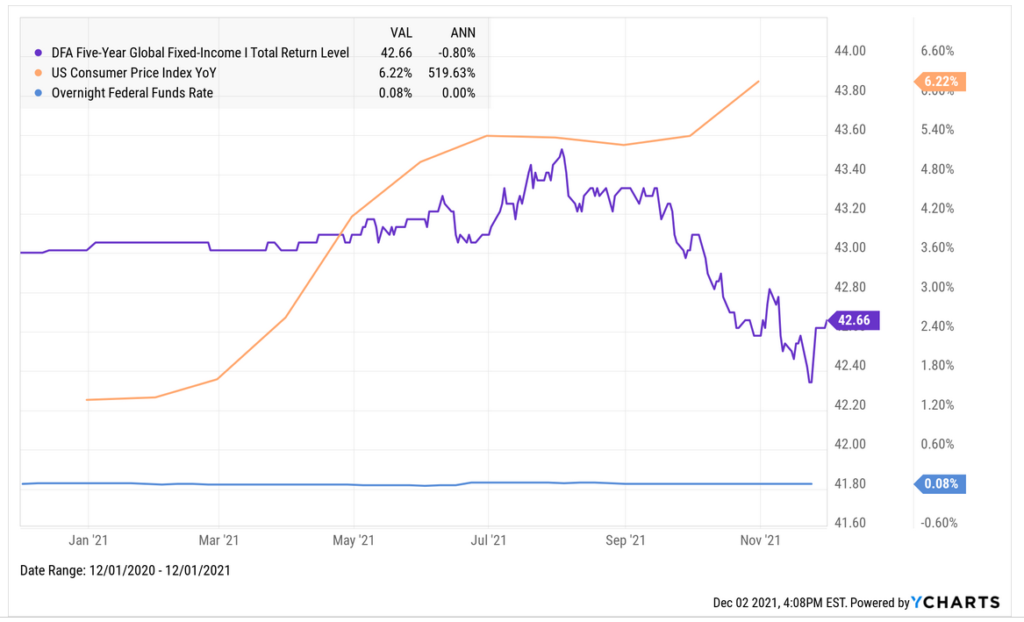
If you’re a Client of Yeske Buie and you’ve been keeping tabs on the bonds in your financial accounts over the past year, you’ve probably noticed the returns have been… less than stellar. Through the end of November, the primary bond fund we use (DFGBX, DFA’s Five-Year Global Fixed Income Fund) is down 0.8% over the past 12 months. Given that inflation over the same time period has been measured as high as 6.2%, we wouldn’t fault you for being concerned about the fund’s performance.
The chart below maps out DFGBX’s performance over the past year (purple) and includes the tailing 12-month inflation figure (CPI; orange) and the Federal Funds Rate (the baseline interest rate manipulated by the Federal Reserve; blue).
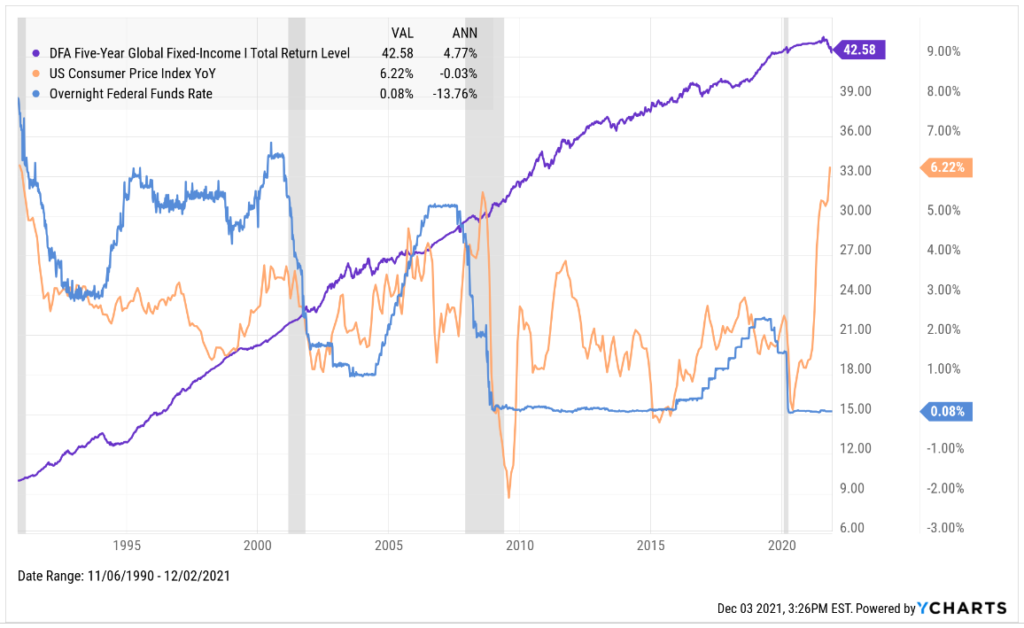
And although we agree that a picture can be worth a thousand words (or more, depending on who’s writing the blog post…), we also believe that more pictures can be even more valuable if they add context to the story. So let’s zoom out and look at the same three items over a longer period; the chart below tracks them over the past 30 years.
We find it interesting that since DFGBX’s inception in November of 1990, it has averaged an annual return close to 5%. And that performance has been consistently good irrespective of what the inflation readings have been over the same period – you can see that there isn’t much correlation between the (sometimes) wild oscillations in the CPI data relative to the steadily climbing value of DFGBX. And since we’ve been on an inflation kick this year, we’d be remiss if we didn’t mention that inflation has spiked during the recovery from every recession (depicted by the gray bars) over the same time period. More importantly, CPI normalized and hovered around 2% in the intervening years until the next recession in every case. Another article for another day, perhaps…
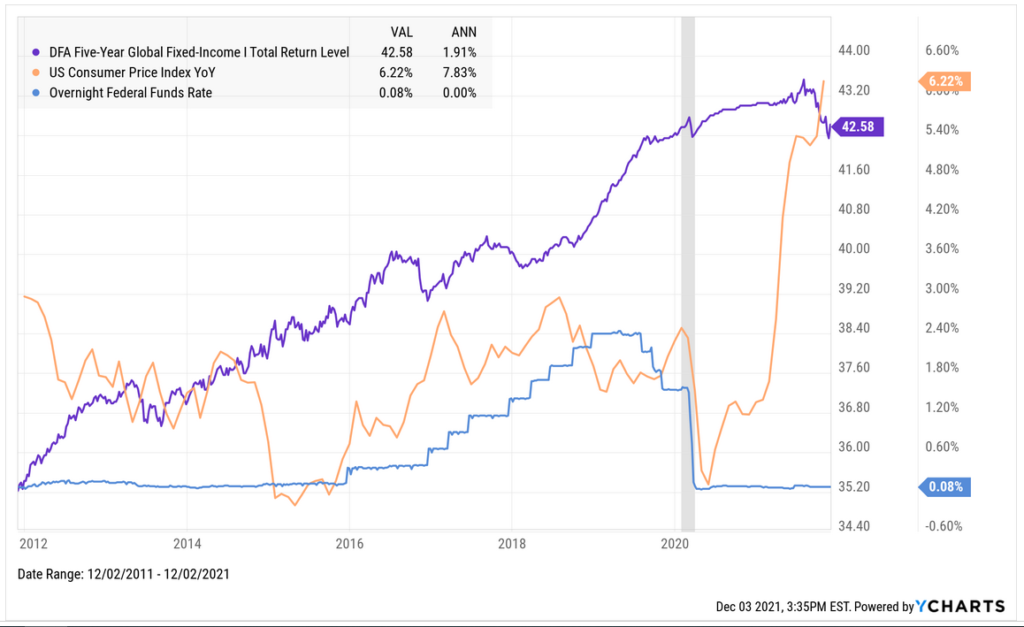
We also note that around each of the four recessions depicted in the chart, the Federal Reserve lowered the baseline interest rate significantly (and in the past two cases lowered it to effectively zero) to stimulate the economy’s recovery. Also note that in each instance that the rate is lowered, DFGBX’s performance subsequently flattens for a time, then picks back up after the Fed begins raising rates as the economy progresses through its next growth cycle. We can observe this dynamic clearly if we now zoom in on the past ten years – see below.
Observe how the incremental increases to the Federal Funds Rate in 2016 and 2017 were followed by a spike in DFGBX’s performance in 2018 and 2019. Likewise, you can observe the curve clearly flattening out immediately after the baseline rate was slashed to zero in the spring of 2020. Zoom in further and the picture becomes even clearer – see below for a chart spanning the last three years.
So what could this mean for future returns? Before we look forward, we must first look backward to set the stage. DFA’s portfolio managers work diligently to position this fund to capitalize on the ever-changing economic environment. Last year’s circumstances dictated a move to short term bonds to mitigate risk; although the name of the fund indicates an average maturity of five years, the maturity of the underlying holdings last year was about 12 months. Why? There simply wasn’t enough additional yield available to justify the risk of going longer than a year. Fast forward to now, and with all of those one-year bonds maturing, the fund managers are capitalizing on the opportunity to reinvest at higher rates as rates rise (coincidentally, the average maturity of the fund is now closer to four years).
And it’s an approach that works. The last time the fund posted a negative return (2013: -0.4%; a year in which the Federal Funds Rate was at zero), it beat its benchmark in each of the subsequent four years (even though the Federal Funds Rate remained at/near zero for most of that time period):
- 2014: 2.9% (vs. 1.9%)
- 2015: 1.5% (vs. 1.0%)
- 2016: 1.8% (vs. 1.5%)
- 2017: 2.0% (vs. 1.1%)
Federal Reserve Chairman Jerome Powell recently indicated that the Fed may increase the baseline rate sooner than expected to combat inflation (a standard approach the Fed has employed for decades), perhaps as soon as next summer. Given that revised guidance, and within the context of the fund’s historical performance, we think there’s reason to be optimistic about DFGBX’s performance in the coming years (and historical precedent to support that sentiment).
As always, please don’t hesitate to connect with us if you have any questions.
Please click here for performance disclosures related to performance reporting and benchmarks.


