Musings of a Money Mad Man – Yeske Buie v. American Stocks

If you’ve been keeping up with financial markets in 2023, you know a few things:
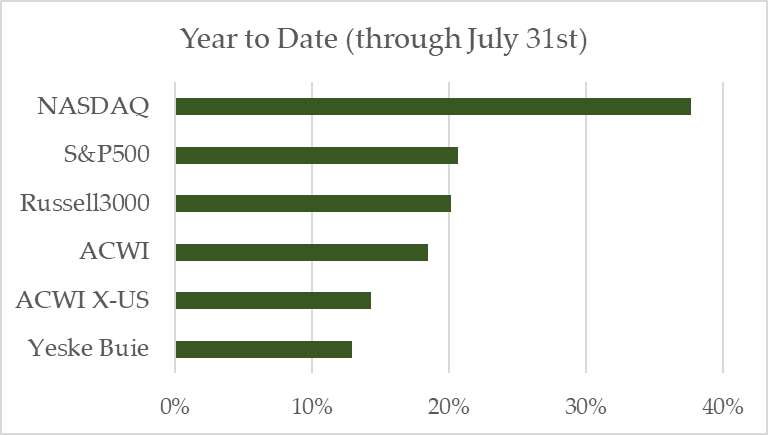
- The NASDAQ (an index primarily composed of US tech stocks) has been on an absolute tear in 2023, up 38% through July 31.
- The S&P500 (an index that tracks 500 of the biggest US companies) hasn’t been doing too shabby itself, up 21% over the same period.
- You may have also heard US stocks as a whole have been doing quite well – the Russell 3000, which tracks the performance of (you guessed it) 3,000 US companies is up 20%, too.
For comparative purposes, the Yeske Buie stock portfolio hasn’t quite kept up, although a 13% return year-to-date beats a sharp stick in the eye. But we don’t really like the way the chart below looks:
So what gives? What’s been driving the outperformance domestically? And why hasn’t the Yeske Buie stock portfolio been earning the same kind of returns in 2023?
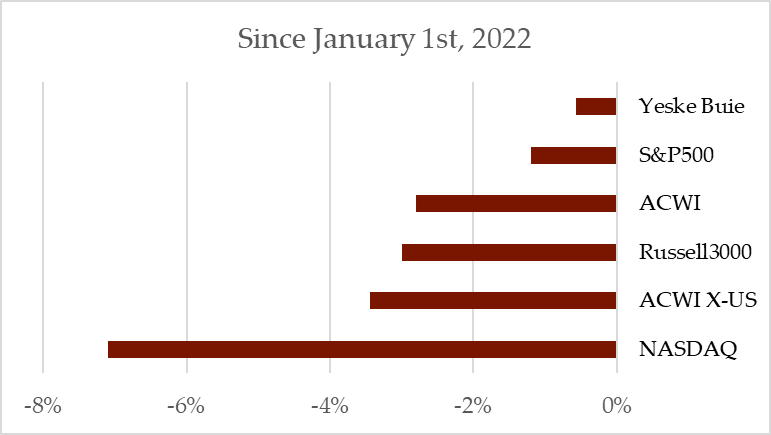
As is always the case, context matters. The downturn that stocks have been working themselves out of over the past 10 months (markets bottomed out on September 30 of last year) started at the beginning of 2022. If we widen the scope a little bit, the story changes quite a bit:
We can make a few statements after digesting this second chart:
- With respect to the indices we’re tracking here, nothing has performed better than the mix of stocks in the Yeske Buie portfolio since the beginning of 2022.
- Note that our portfolio is on the verge of recovering all that was lost in the first three quarters of 2022.
- The NASDAQ has been the worst performer, behind international stocks (captured by the ACWI X-US, which tracks non-US stocks) and stocks around the globe (measured by the ACWI, or All Country World Index).
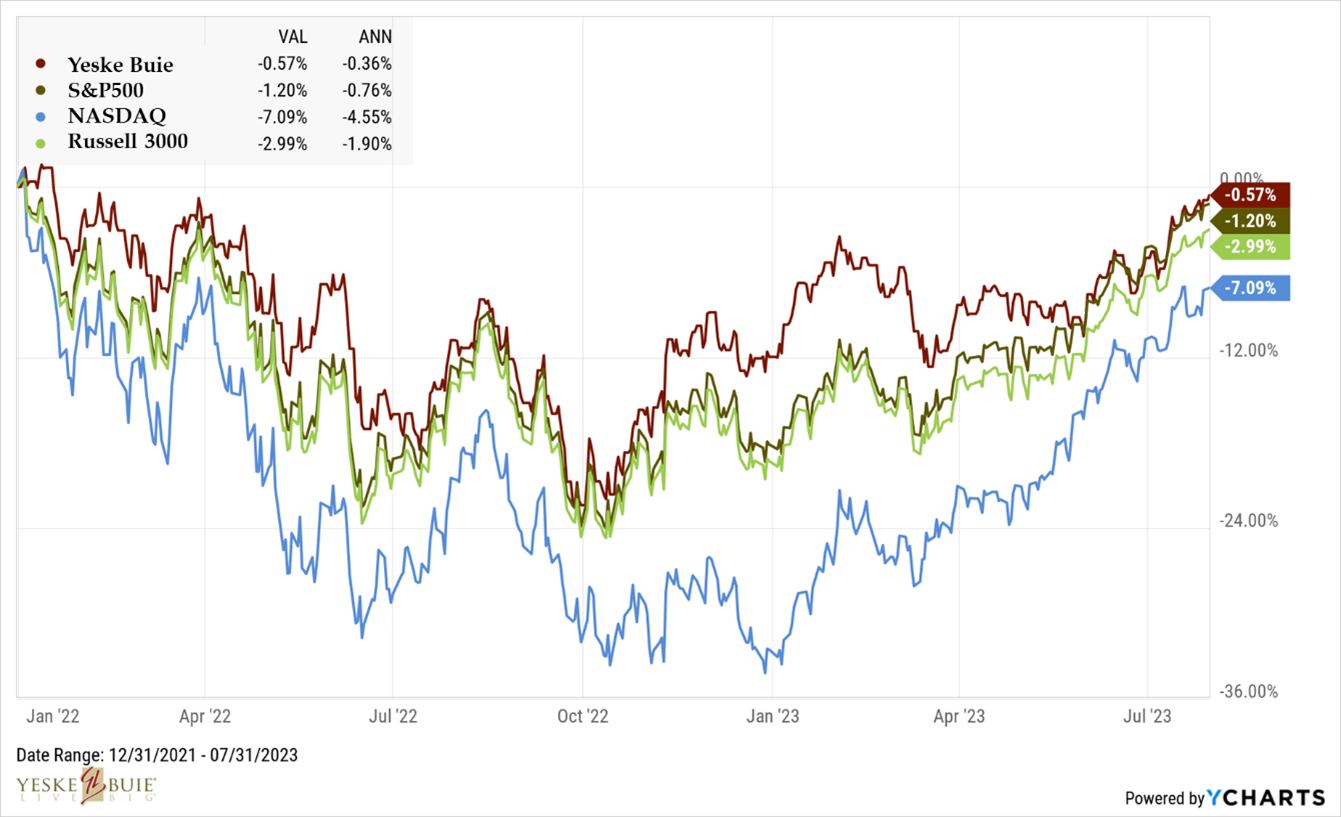
- 2022 was really bad for tech stocks, and 2023 has been really good for tech stocks. While that may not be immediately obvious from the image above, see the chart below – look at how much deeper the dip is on the NASDAQ’s curve.
Note that we’ve remained ahead of the domestic stock indices since the beginning of the bumpy ride that began last year. If we look at the performance of US stocks year-to-date, we have to account for the fact that while US stocks have outperformed everything else during this particular period, they had a bigger hole to dig themselves out of (and they’re still digging).
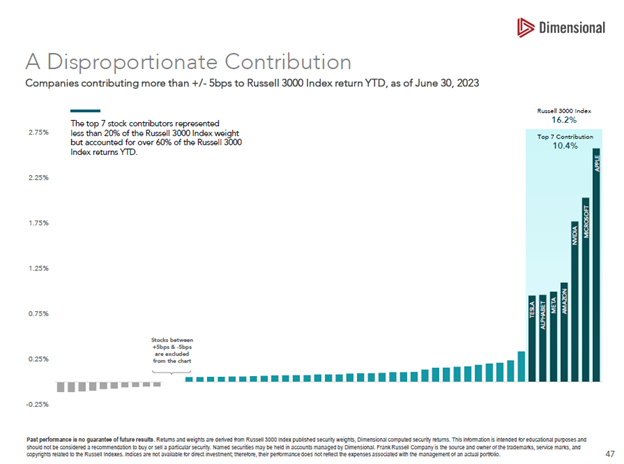
And what’s been driving that relative outperformance in 2023? Not really “what”, but “whom”: the acronym has changed so many times (FAANG, FAAMA, FANMAG) and, in fact, just a few months ago it was the “MegaCap 8”. For the purposes of this article, we’ll go with the “Magnificent 7”: Apple, Microsoft, NVIDIA, Amazon, Meta, Alphabet (Google), and Tesla (sorry, Netflix…apparently you’re no longer “mega enough”).
Let that sink in: through the first half of 2023, seven companies account for 20% of the weight of an index that tracks 3,000 companies. If it was proportional, 20% would be represented by six hundred companies, not ~1% of six hundred companies.
And those seven companies accounted for 60% of the returns. Seven companies accounted for SIXTY PERCENT of the returns of an index that tracks three thousand companies.
Until or unless these companies fail (or are broken up), US stock indices’ returns, whether it’s the Russell 3000 or the S&P500 or the NASDAQ, are going to be skewed by the performance of these enormous organizations (unless it’s an index that focuses on small company stocks 😊).
The story of 2022 (and 2023 thus far) encapsulates the “why” behind our insistence on maintaining a properly diversified portfolio. You never know where growth will emerge in the short run, and you never know from whence risks will pop up on the path forward.
What we do know, however, is that it pays to minimize the volatility of the swings your portfolio takes, and context matters when evaluating performance.


