
Picture(s) Worth 1,000(ish) Words

What a year 2022 was in markets (one could say the same about 2021, or 2020, or…but we digress). Stocks around the world took a beating. As we look forward into 2023, we find no shortage of ink being spilt about the gloom we’ve survived and the doom to come.
If you’re looking for an alternative perspective, you’ve come to the right place (no surprise to frequent readers of our content). We won’t sugar-coat what we’ve been through, and we won’t be slipping on any rose-colored glasses as we plan for the coming year. What we will do in this piece is share a few pictures (read: charts) that we think provide critical context to the stories being told about last year and this year.
Here are the bullet points for those who came for the executive summary:
- The Yeske Buie portfolio has been dominating its benchmark in recent years, and that was certainly the case in 2022.
- This has been true since markets bottomed out in March of 2020; first because small company stocks had been outperforming their larger counterparts, and more recently because value stocks have been on a tear while interest rates have been rising.
- International stocks bested US stocks in 2022, with Big Tech dragging the rest of the US down.
- Continue this conversation with us at our live webinar on January 31.
What follows is the unabridged version, should you feel so inclined to take a deep dive into recent history. First, let’s begin with a top-level review of 2022. The chart below compares the performance of the stocks in our portfolio (purple) to the S&P500 (orange), MSCI All Country World Index (“ACWI”; blue) and the MSCI All Country World Index Ex-US (“ACWX”; green).
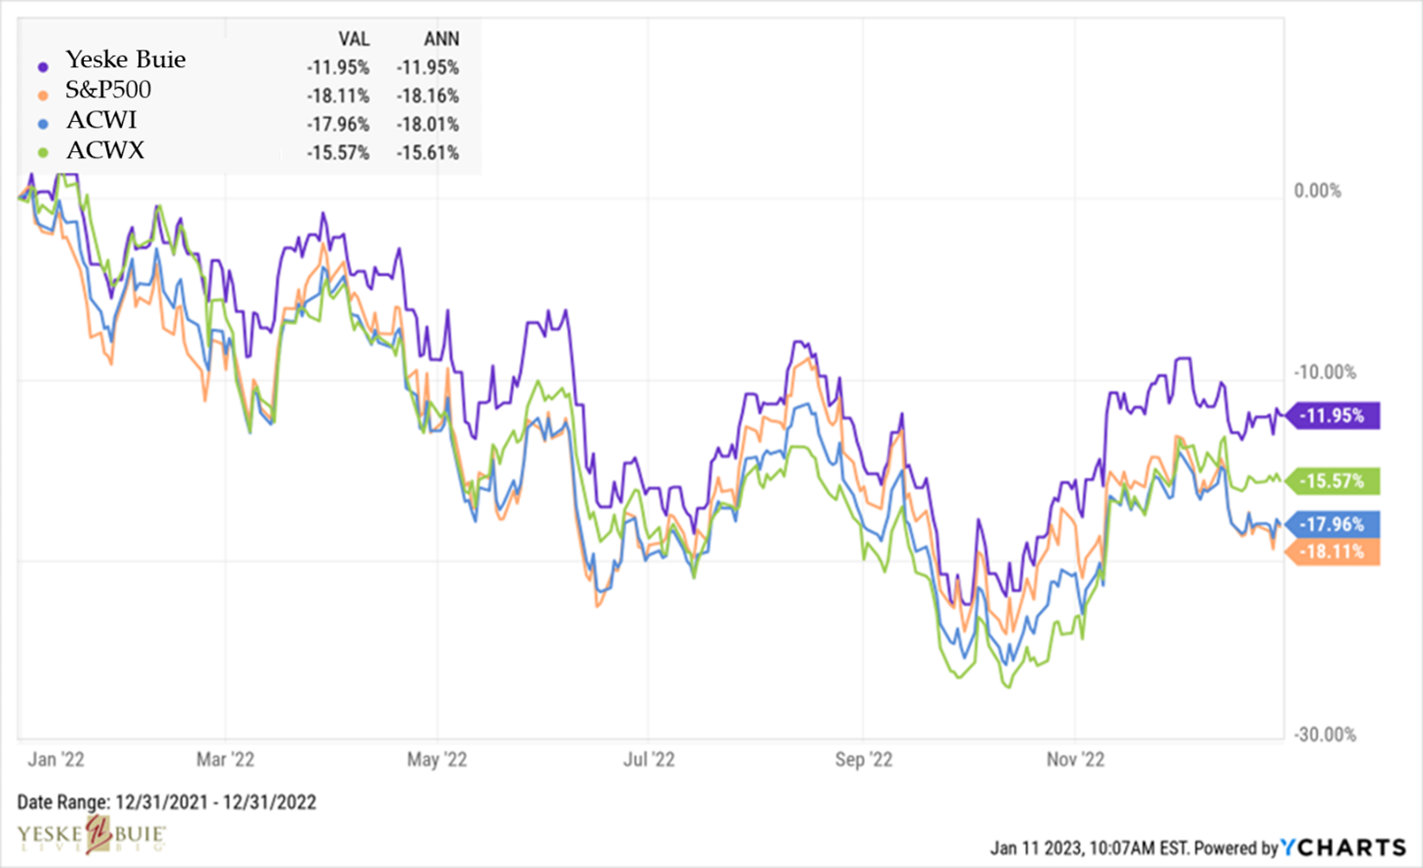
Our globally diversified portfolio outperformed its benchmark, the ACWI, by a full 6%. We bested the S&P500 by even more, although we’ll note that it’s not really an appropriate benchmark given that it’s comprised of “only” 500 US large company stocks (whereas there are more than 10,000 stocks from around the world in our portfolio, and we skew in favor of smaller companies’ stocks and value stocks – more on those later). Note that international stocks outperformed US stocks by a considerable margin.
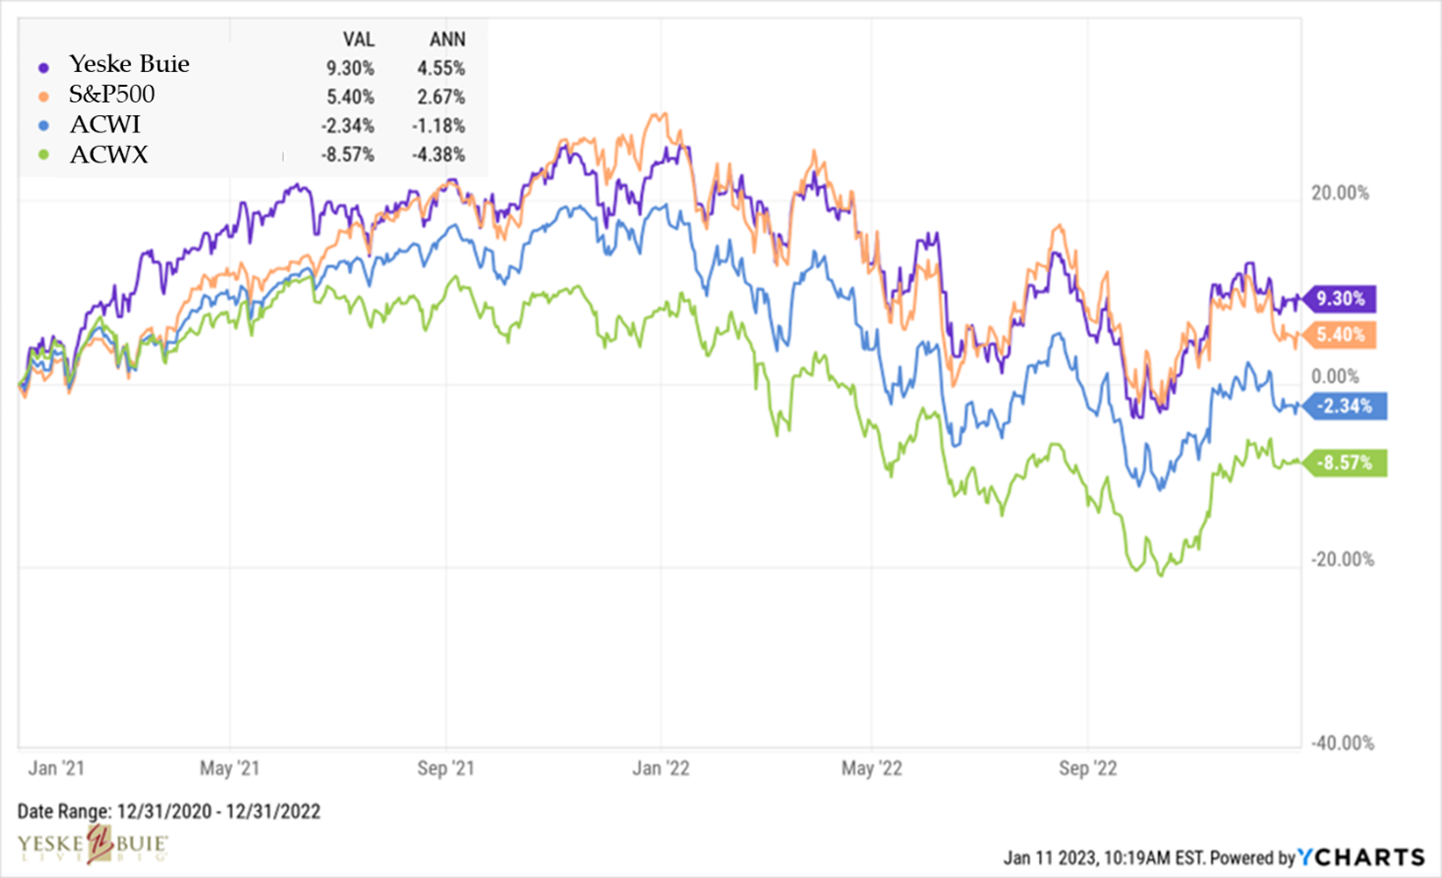
And this isn’t a trend that’s unique to 2022 – our portfolio has outperformed those indices for the past two years:
We can zoom further out and note that our portfolio has had a stellar run throughout the current market cycle; since markets bottomed out on March 23rd, 2020, our portfolio has been on quite the run, outperforming the S&P500 by nearly 3% per year and the ACWI by nearly 6% per year:
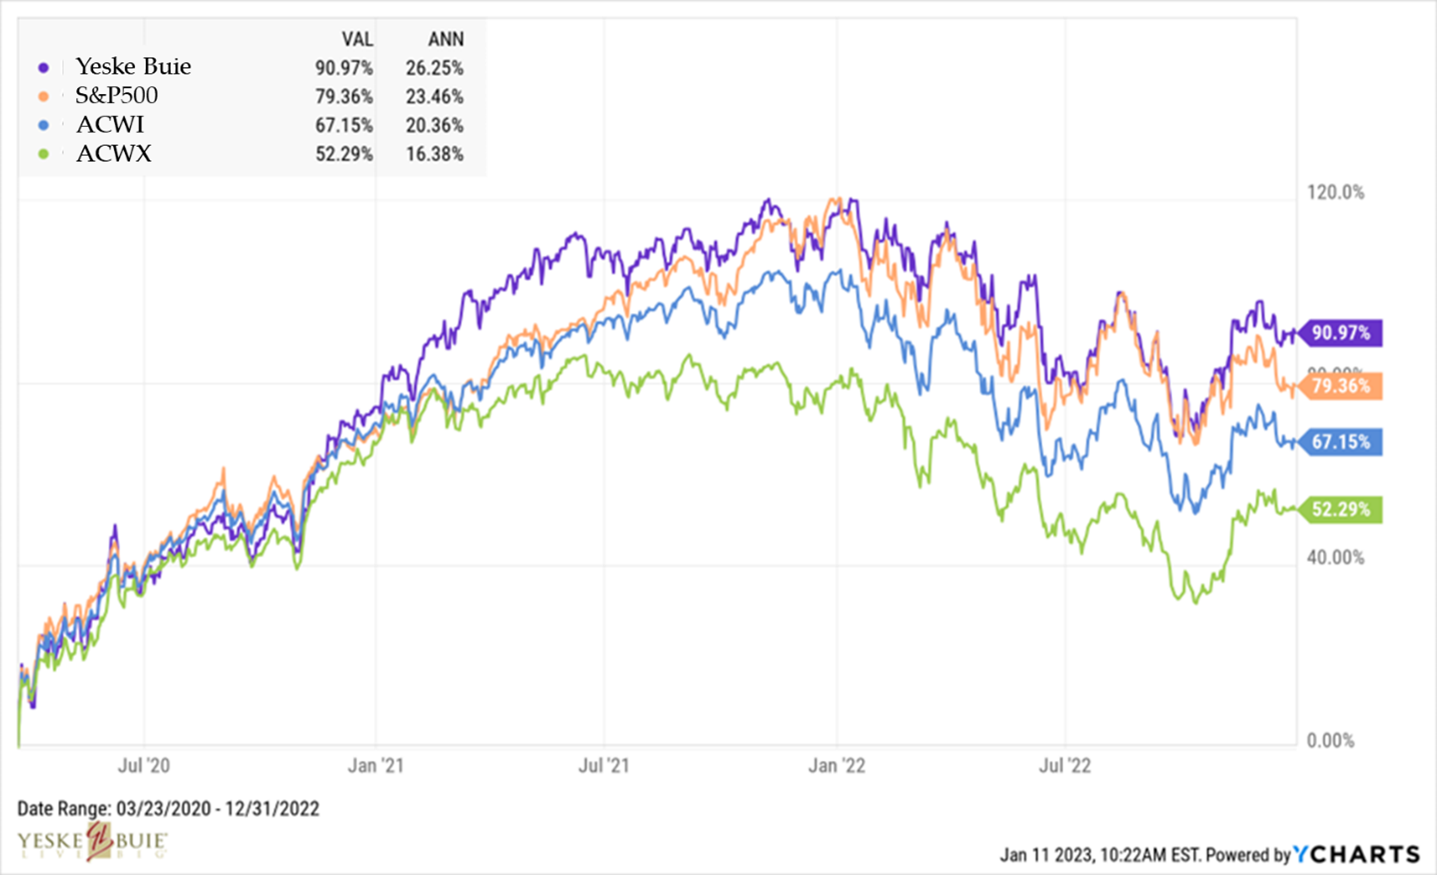
What’s the story behind this story? Well, it has a few components. After escaping the first quarter of 2020, markets took off after pricing in the havoc COVID-19 would wreak on the world. Initially, nothing performed better than small company stocks, specifically in the US. That’s not unexpected; the pandemic hit the reset button on markets and the economy, and we began new cycles in each. And small company stocks are cyclical, meaning they tend to perform best at the beginning of market cycles – a persistent and pervasive phenomenon we’ve observed over a century. That trend stretched for seven quarters, through the end of 2021.
The focus shifted in 2022. Inflation had begun to bubble up in the latter half of 2021, and the Fed began making noise about raising interest rates to cool off an economy that had run red-hot throughout the recovery. And so as they began to raise rates in 2022, a different segment of the portfolio began to dominate: value. For more on what makes a value stock a value stock, and an efficient explanation as to why higher interest rates create a favorable environment for value stocks, see this brief video we shared last year. To see how things played out in our portfolio in 2022, see the chart below:
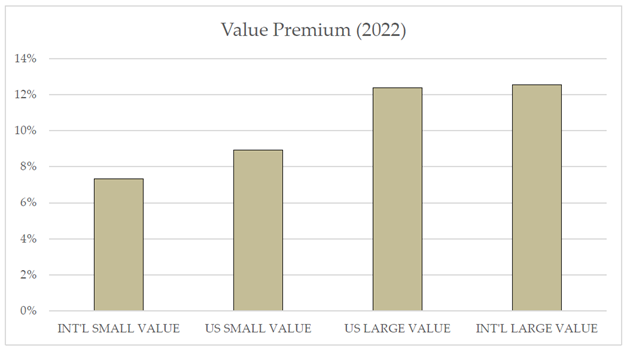
Within each of the four major areas of our portfolio, value stocks outperformed growth stocks. By a lot. In the cases of US Large and Int’l Large companies, the margin was greater than 12%.
But wait: we’ve told you what a value stock is, but what’s a growth stock? Imagine a company that’s grown and grown and gotten so big that it is having trouble continuing on that growth path. You might be able to conjure up a few names of companies that fit the profile from the past decade. Amazon, maybe? Meta (the artist formerly known as Facebook)? Tesla? We’ve got a chart for their performance in 2022, too:
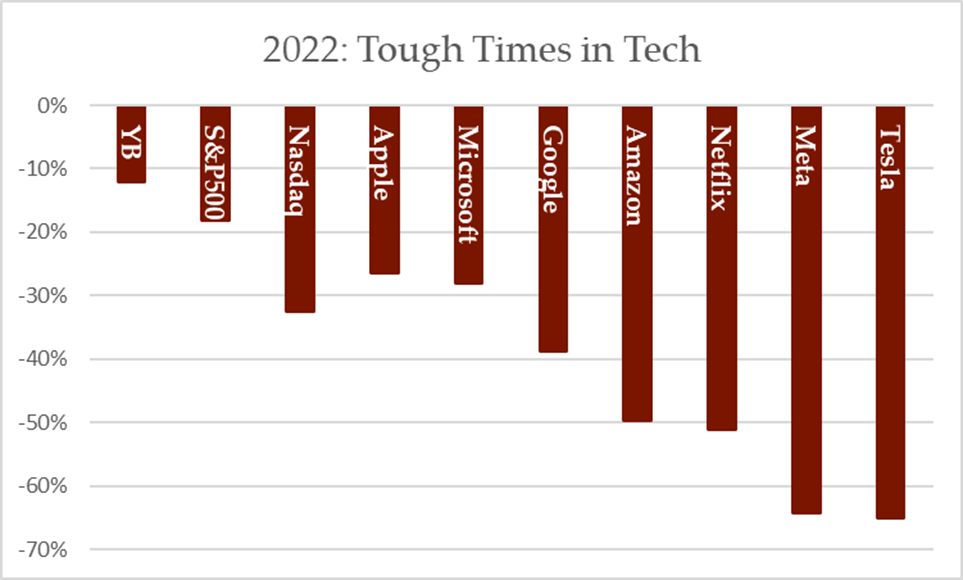
A number of the biggest companies in the world all fit into the Tech Sector of the S&P500, skewing the index’s performance along the way. When Big Tech was blowing everything out of the water prior to 2020 and the FAANG+ stocks were all the rage, the S&P500 (and even more so, the Nasdaq, which focuses on tech stocks) dominated. But we diversify, in part, because of the law of financial gravity: what goes up, must come down. And one never knows when the reversal will occur, or how quickly and dramatically things will fall. In this case, the changes in economic circumstances hit the tech giants the hardest.
So where does all of this leave us with respect to 2023? Is a recession coming? Will the Fed continue to raise rates? What does that mean for the economy? What does that mean for financial markets?
We cannot predict how the year will unfold. And no one has ever been able to do so with any real reliability or consistency, which, again, is why we diversify (for example, hands up if you had international stocks ending 2022 ahead of US stocks when news broke about the Russian invasion of Ukraine last year). What we do know, however, is that markets operate as discounting machines – they’re always looking to the future. We also know that economists make terrible prognosticators, and that economic data is generally backward-looking. So, that means that markets generally portend what’s going to happen in the economy. And the chart below tells the same story:
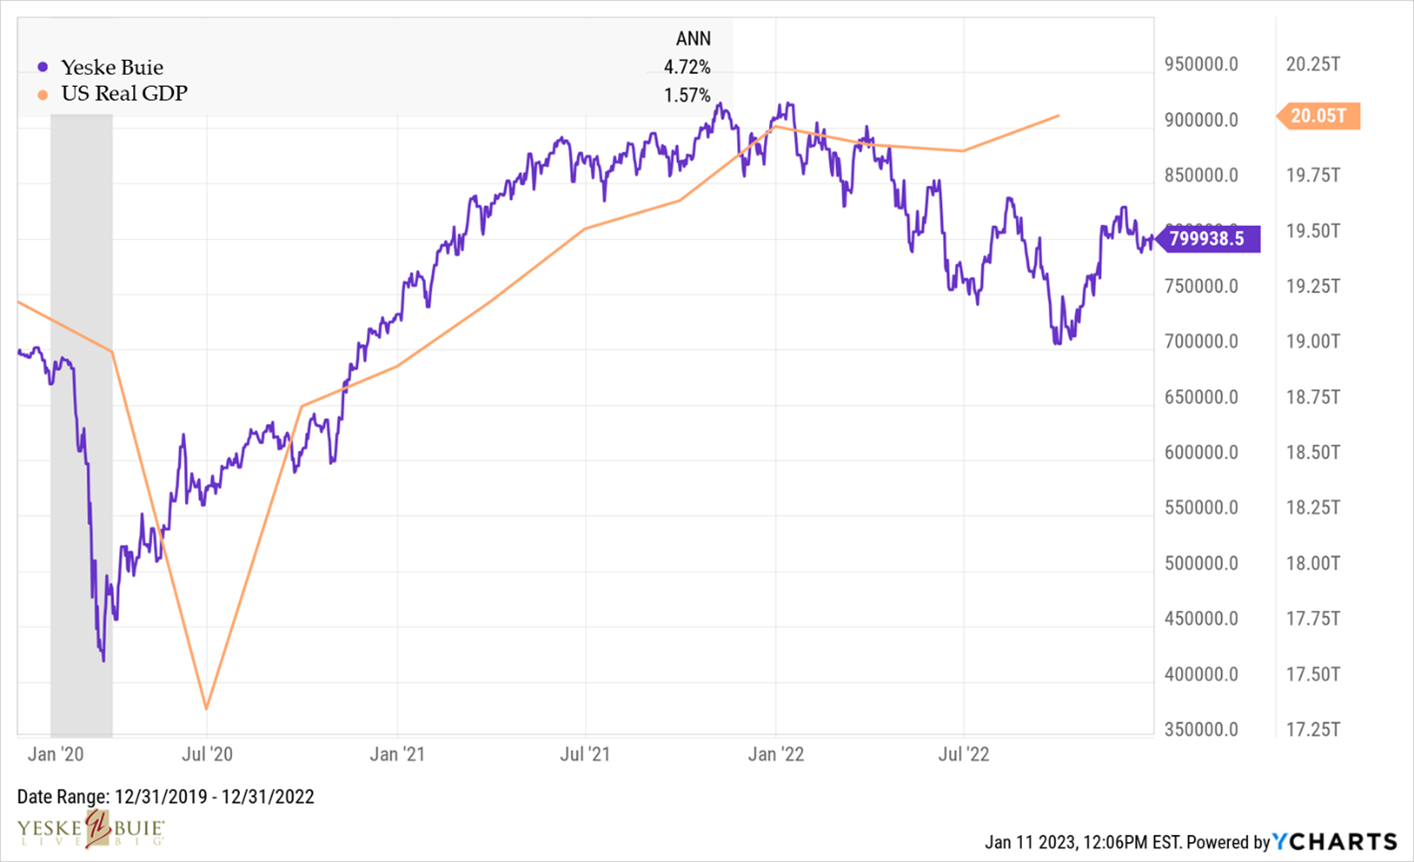
Two curves, similar shape; our portfolio is measured by the purple line, and total economic output in the form of Real GDP (Gross Domestic Product, adjusted for inflation) is depicted by the orange line. Note that our portfolio of stocks served as the leading indicator as we navigated the last recession we experienced in 2020 (indicated by the gray bar). And that’s not unique to the COVID crash and recession – the same held true in each of the other three recessions that have occurred since 1994 (our portfolio’s inception).
Whether markets have finished pricing in the “pain” Federal Reserve Chairman Powell keeps mentioning is anyone’s guess. And no one knows if a recession is coming (or if we survived one in 2022; after all, Real GDP did contract for two consecutive quarters to start the year, which is the traditional definition of a recession).
We can, however, be confident about the following: the Yeske Buie portfolio has met the challenges posed by the past few years (as it has in every preceding challenging period over the past three decades) and it has served our Clients well. And we don’t see that story changing any time soon. If you’re interested in continuing this conversation with us, register today to join our live webinar – What’s Our Story? – on January 31 at 11am PT | 2pm ET.
Editor’s note: the word count of this piece is 1,267 (including this sentence).