
Portfolio Strategy Update: Toward a Truly Global Portfolio
Moving to a “Geographically-Neutral” Allocation
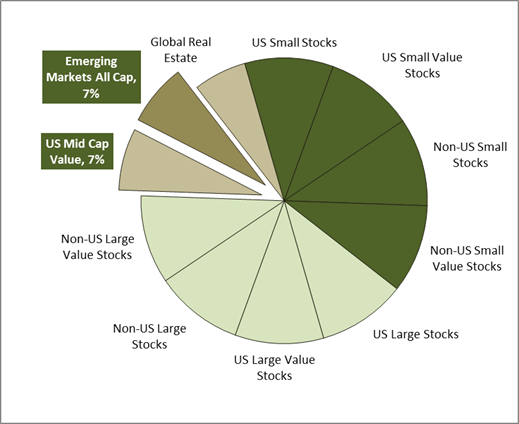
You’ve often heard us say that it makes sense to be “geographically-neutral,” that there is no systematic return associated with geographic allocation. One exception in recent years has been an extreme under-weighting of so-called Emerging Markets, which for some time represented less than a tenth of their true market weight in our portfolios. We moved to shift that balance in January (The Case for Emerging Markets) and have now made a further shift toward emerging markets that has completed this transition to a “geographically-neutral” allocation. Which is to say that each geographic region – US, Non-US Developed, and Non-US Emerging – will have portfolio allocations roughly equal to their share of the world market. We have achieved this shift by swapping the iShares US Midcap Value fund into the DFA Emerging Market Core fund (see illustration below).


Beyond the virtues of being more “geographically-balanced,” the case can be made for the future growth potential of emerging market economies and markets. Burton Malkiel, Princeton professor and author of “A Random Walk Down Wall Street,” made this case in a recent piece written for IMCA.
On the other hand, many of the emerging economies with their low levels of government and personal debt and their much younger populations will continue to be responsible for an increasing share of global growth. The emerging economies endowed with abundant resources should compete especially well with the developed world. The equities of emerging economies with more favorable debt levels, demography, and abundance of natural resources will benefit relative to countries less favorably situated.
Allocations are not neutral across all dimensions
One thing that is not “neutral” in our portfolios is the relative allocation to small company and value stocks. We very intentionally “dial-up” our exposure to those two types of securities relative to their share of the market. The impact of this can be seen in the chart below, which shows the cumulative growth of the MSCI All Country World Index versus the Composite Returns of all Yeske Buie portfolios from December 30, 1994 through September 28, 2012. The All Country World Index is “market-weighted,” which means it allocates weights to stocks based on their share of the market. This has the effect of allocating most of the weight to large company stocks. We believe the primary reason for the difference between the index and the YeBu portfolios is due to our larger allocations to value stocks and small company stocks relative to their weighted share of the market. It should be noted that the All Country World Index is 100% stocks, while the YeBu portfolios range from 70% to 90% stocks. The chart would favor the YeBu portfolios even more if we only looked at the equity allocations (Important Disclosures Related to Performance Reporting and Benchmarks).
