Weekend Chart Challenge – Revisited


Back in August of 2015 markets around the world had gotten choppy after a period of extended calm and some were asking what was up and what was next. We offered the Weekend Chart Challenge as a way to put it all in perspective. Late last year, markets got choppy again, declining quite a bit in the last three months of the year before bouncing back in early 2019.
While we’ve had plenty of good times in the market over the last few years, it’s always the rough times that grab our attention. And so, yet again, many are asking what’s up and what’s next.
As always, the answer is that we don’t know, not in the short run, anyway. However, we do have a high degree of confidence where we’re heading in the long run, it’s just a matter of perspective. Of course, it’s hard to maintain perspective amidst the steady drumbeat of scary headlines: trade war with China, border “crisis” with Mexico, the Mueller Report, Brexit, Fed uncertainty, political polarization, healthcare debates, we could go on and on. The headlines will always be there, appealing to our natural tendency to focus on the negative.
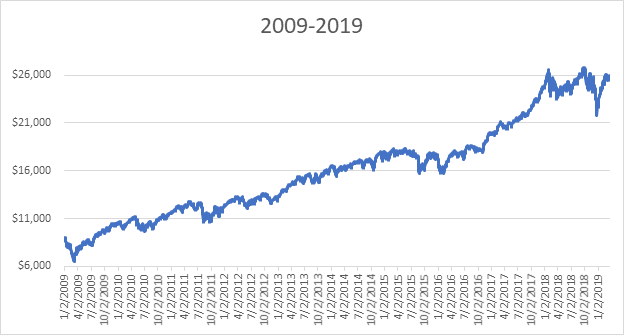
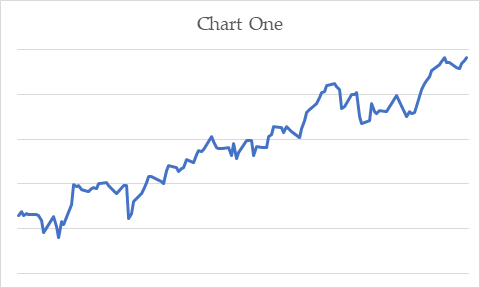
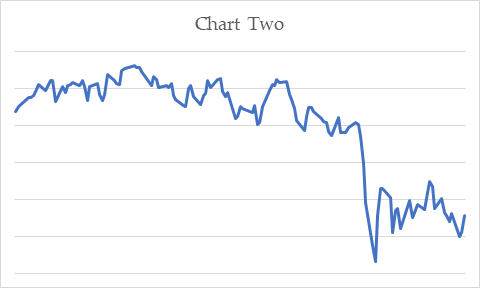
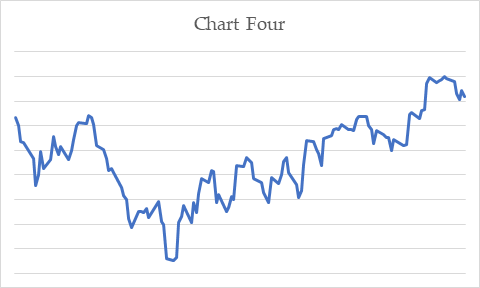
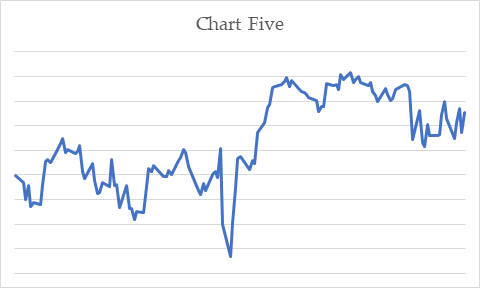
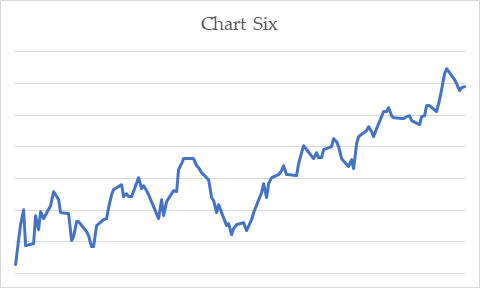
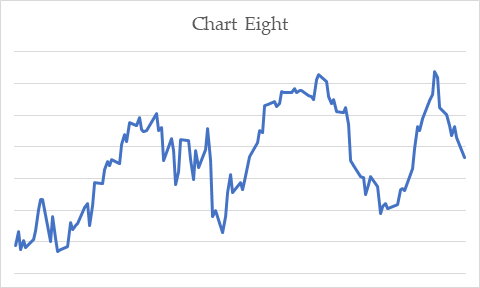
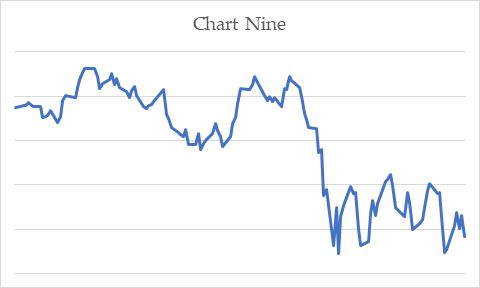
So, three-and-a-half years later, again in the spirit of that wonderful French saying plus ça change, plus c’est la même chose (the more things change, the more they stay the same) we’d like to offer up another visual pop quiz. In the 10 charts below, we’ve illustrated the daily value of the Dow Jones Industrial Average during the “middle” six months of each year (April through September) over the decade since the Great Recession. We invite you to attempt to match each chart to its respective year.


Answer Key:
- Chart One: 2017
- Chart Two: 2015
- Chart Three: 2009
- Chart Four: 2012
- Chart Five: 2016
- Chart Six: 2018
- Chart Seven: 2010
- Chart Eight: 2013
- Chart Nine: 2011
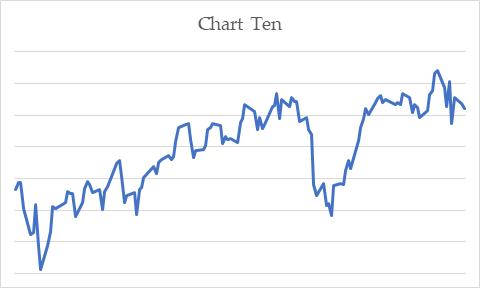
- Chart Ten: 2014
How did you do?
Now, for the most important chart, the one that shows the full ten-year period. Obviously, something good was going on during this past decade that is hard to see when your window is only six or 12 months long, a window that will always be dominated by the “noise” of the daily news.