
Managing Risk in a Rising Stock Market
U.S. stock indices have been hitting new highs in recent weeks, prompting many to ask if the market has become “overpriced” and, if so, what can we do to mitigate risk?
In order to answer these questions, there are several others that must be addressed first, including the following:
- Which market are we talking about?
- What do we mean by “overpriced”?
- What actions are viable in the face of uncertainty?
Which markets are we talking about?
While it’s true that the Dow Jones Industrial Average, S&P 500 and other major U.S. stock indexes have been hitting new highs, these are only one segment of the global stock market. Markets outside the U.S. have not advanced at quite the same pace, with non-US Blue Chips matching only 60% of the S&P 500’s gain over the past 12 months. Some segments, like Global Real Estate and Emerging Market Stocks have advanced only one-sixth as much as U.S. Blue Chips. So, while markets the world over have been rising of late, there’s wide variability with respect to magnitude.
What do we mean by “overpriced?”
It’s important to distinguish between the price level of the market and its valuation level. It’s only the latter that can tell us if stocks are overpriced. Specifically, what matters is how “expensive” stocks are relative to their earnings or assets. One such measure is the “price-to-earnings” or P/E ratio. This tells you how much you have to pay for every dollar of earnings a company has produced over the trailing 12 months (often shortened to the TTM P/E). When the S&P 500 crossed the 1,500 level in February of this year, it had a P/E ratio of 17 compared to the first time it crossed that level in 2000 when the P/E wass 28 (source: multiple.com). Clearly, stocks are “cheaper” now than they were then, even though the price level is the same.
Since February the index has risen further, at one point crossing the 1,800 level, and the P/E ratio is now about 19 compared to a long-run average of around 15. The long-run average P/E can be a deceptive benchmark, however, as it must be assessed within the larger context of the economy. Price-to-Earnings ratios are influenced by many factors including the prevailing interest rate. That long-run average level of 15 includes many periods of high interest rates — such as those that prevailed in the 1970s — when the P/E ratio was in single digits. All other things being equal, we expect the ratio to be in the higher range when interest rates are extremely low, as they are now, just as we expect it to be in the lower range when interest rates are very high.
And returning to the question of markets outside the U.S., the P/E for the MSCI World Index is currently just about equal to its long run average. A global portfolio of stocks allocated in a geographically-neutral fashion, therefore, would have more than half of its holdings well within normal valuation ranges.
A final point to consider is that P/E is a highly unstable measure that can be hard to interpret. It rose massively in early 2009 because corporate earnings were falling even faster than prices, and yet that was a brilliant time to be invested, with markets rising 160% since then. It can also rise in anticipation of forward looking growth in earnings. The U.S. economy has been growing slowly since 2009 but regularly defies analysts’ estimates with surprising resilience. Just today, the Commerce Department revised its estimates of the third quarter growth rate of the U.S. economy from 2.8% to 3.6%. Perhaps the collective wisdom of the market is factoring continued strong corporate earnings growth into stock prices.
What actions are viable in the face of uncertainty?
In many ways, this is the most important of the three questions. That’s because any assessment of valuation levels and relative “expensiveness,” no matter which markets we’re talking about, are fraught with uncertainty. It’s often the case when dealing with complex systems like the economy in general or financial markets in particular that “averages” are a poor guide to action. That is, you can be right and still be wrong. An historical case in point began in January of 1995 when the S&P 500 was registering a P/E of 14.89, just about exactly the long-run average for the index. A year later, after rising by more than 37%, the index’s P/E ratio had also risen to an above-average 18.08. Many people looked at the prior year’s return and the valuation level of the index and decided that the party was over. It wasn’t. The index rose by another 23% in 1996, then 33% in 1997, 28% in 1998, and 21% in 1999. We know that it all came to tears in 2000 with successive annual losses of 9%, 12%, and 22%, but a patient investor was still better off for having stayed in the “overvalued” markets of 1996 – 1999 and suffered the subsequent declines than to have moved to the sidelines after the gains of 1995.
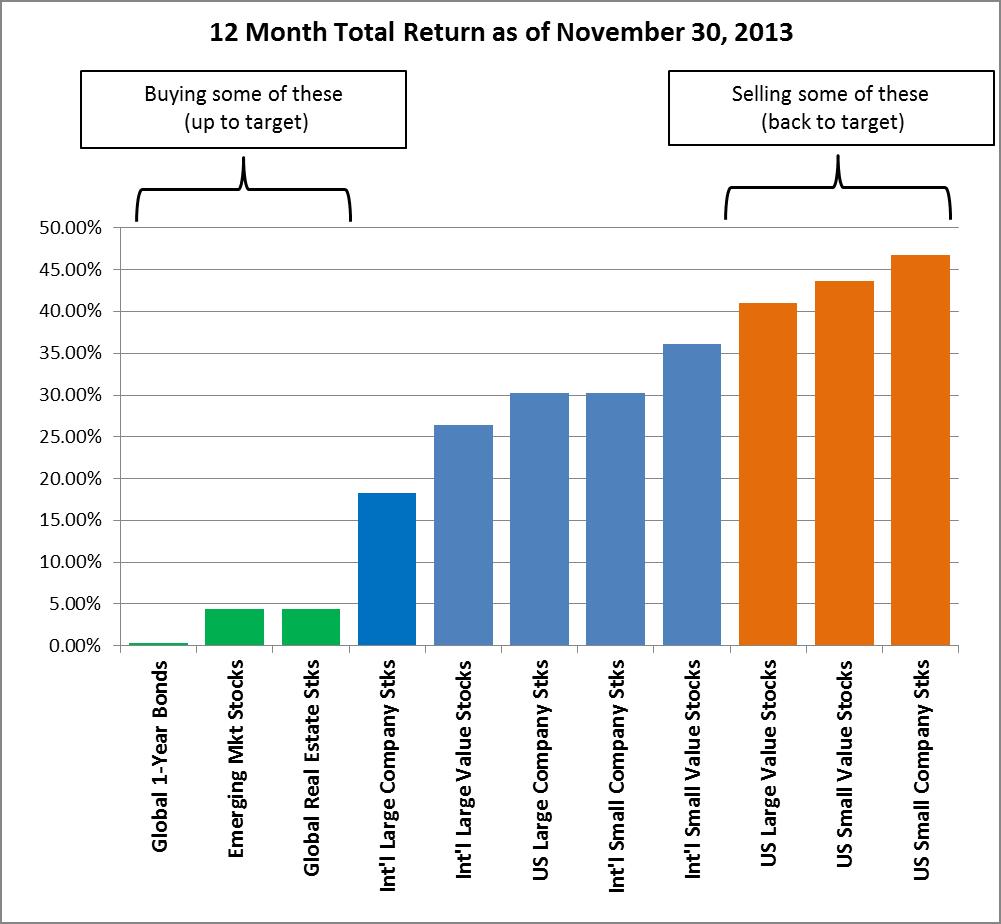
At the end of the day, the most powerful way to manage the risk that markets will get ahead of themselves and suffer a correction is to practice a disciplined approach to rebalancing. As the chart below illustrates, not all markets have been moving in lockstep, with bonds, emerging market stocks, and global real estate all significantly lagging other markets, especially U.S. small company and large company value stocks. As a result, the rebalancing discpline we practice at Yeske Buie has had us recently selling those domestic small cap and value stocks back to target and adding the proceeds to our short-term bond, emerging market, and global real estate holdings. By selling the hottest performing categories back to their target allocation, we’re effectively “taking money off the table” and moving it either to our stable, short-term bond reserves, or to stock categories that are sporting more attractive valuations. We don’t try to outguess the market, we let it tell us where and when to reallocate capital. We also don’t make sweeping judgments based on averages that have little meaning in the short-run, instead remaining committed to core targets for all of our asset classes over the long-run.
 source data: Yeske Buie fund performance calculations
At the end of the day, we are always interested observers of market and economic statistics, while also recognizing how difficult it is to act based on short-term applications of long-term averages. We believe it is better to use systems that capture long-run propensities over the long-run. This is the best way to match your action to the nature of the data. As we noted in Chaotic Systems, or why the market is a lot like the weather, the difficulty with predicting something as highly-variable as rainfall in the short-run doesn’t prevent us from taking effective action over the long-run. For example, if you were to ask us for our best estimate of the rainfall in Northern California during the 2013/2014 rainy season, our best guess would be the long-run average of 20 inches. And we will almost surely be wrong. But that doesn’t prevent water managers from sizing the region’s reservoirs such that the water needs of its citizens can be met as long as that long-run average is realized over any 7 to 10 year period. Likewise with an investment portfolio, if it’s designed for resilience. And resilience means broad diversification so as to avoid the kind of permanent losses that can result from over-concentration in a few narrow sectors, along with sufficient liquid reserves to meet spending needs for an extended period during any cyclical downturn in the stock market. This, combined with the kind of disciplined rebalancing system discussed above, is the best way to position yourself to ride through the inevitable ups and downs with confidence.
The Yeske Buie Team
Related articles: